Trading the Latest Surge in Gold Prices
After a quiet start to the year, the precious metals sector of the financial markets has caught fire in recent weeks, with gold prices poised to capture a fresh all-time high.
After a quiet start to 2021, gold prices have been on a tear lately, and could tip a new all-time high in the foreseeable future.
Like most things in the financial markets, gold has been on a rollercoaster ride since the global COVID-19 pandemic started. The price data below—showing gold’s highest closing price during the year indicated—helps illustrate the impact of the pandemic on gold prices:
- 2019: $1,542.60
- 2020: $2,058.40
- 2021: $1,946.60
At the start of 2021, gold prices were $1,893.66, but reached a low of $1,684 on March 30. Gold prices have since recovered, appreciating 13% to $1,904 in the last two months. The big question now is how much upside might be left in the current rally.
Gold prices can move for a variety of reasons, but it’s important to remember that one of those relates to the value of the U.S. dollar.
This is important because when a sovereign country like the United States drops interest rates, as it did during the outset of the pandemic, that can translate to a lower currency valuation. That in turn means more dollars will theoretically be required to purchase the same amount of gold.
In that regard, some of gold’s appreciation in 2021 is likely attributable to continuing depreciation in the value of the dollar.
U.S. Dollar Slide Continues
While interest rates in the United States have increased during 2021, the dollar remains under pressure. The U.S. Dollar Index (DXY) has dropped from roughly $102 in March of 2020, to just over $90 today.
Moreover, the U.S. dollar has been steadily depreciating against the Chinese yuan in recent months. The relationship between the dollar and the yuan has become more important over the last decade, due to the fact that these two countries now represent the two largest economies on earth.
After notching a multi-year high against the yuan of $7.16 in June of last year, the dollar has steadily declined in value against the yuan.
Exchange rates are typically quoted using the format “ABC/DEF,” and are interpreted to mean that the first currency listed is a single unit, while the exchange rate itself represents the amount of the second currency that is required to purchase a single unit of the first currency.
For example, the current USD/CNY exchange rate is currently about 6.35, which means it takes roughly 6.35 yuan to purchase a single dollar. Last year it would have taken 7.16 yuan to purchase a single dollar, indicating the dollar has depreciated 11% against its Chinese counterpart over the last 11 months.
The weakness in the dollar relative to the yuan provides further insight into why gold prices may currently be strengthening.
Trading the Gold/Silver Ratio
Looking beyond currencies, it can also be helpful to analyze gold prices relative to other assets/commodities—especially other precious metals such as silver. For example, gold and silver share an extremely strong, positive historical correlation of about 0.89.
Due to their longtime link, many traders use a metric known as the “Gold/Silver Ratio” to further analyze the relative value of gold. This ratio was covered in detail during a recent installment of Options Jive on the tastytrade financial network.
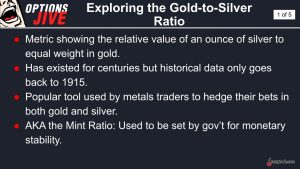
As outlined on the show, the Gold/Silver Ratio is calculated by simply taking the current price per ounce of gold and dividing it by the current price per ounce of silver. The quotient of that equation reports how many ounces of silver are required to buy a single ounce of gold at any given point in time.
For example, at the start of 2019, when gold was trading for roughly $1,283/ounce, and silver was trading for $15.70/ounce, that meant approximately 82 ounces of silver was required to purchase a single ounce of gold.
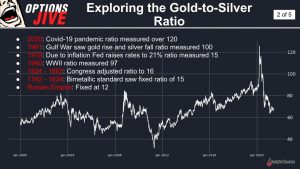
When gold prices left silver prices in the dust during the summer of 2020, the Gold/Silver Ratio climbed toward the higher end of its historical range—roughly 114. However, silver prices eventually caught up to gold prices later last year, ultimately pushing the ratio back down to about 80 by September.
Currently, the Gold-Silver Ratio is trading about 68, which is slightly above the longer-term average observed over the last 20 years—roughly 60.
Traditionally, pairs traders buy gold and sell silver when the Gold-Silver Ratio reaches the lower end of its historical range (i.e. below 50). Such a position theoretically benefits from an increase in the ratio—which requires gold to go higher, silver to go lower, or both. The reverse position is considered when the ratio jumps to the higher end of its historical range (i.e. above 100).
Traders can also take naked directional positions in gold and silver, depending on their outlook. Or even consider trading precious metals volatility using options in single stocks and ETFs.
For more information about the Gold/Silver Ratio, readers may want to review the complete episode of Options Jive when timing allows. A previous episode of Market Measures also provides critical insights on gold volatility and skew.
For updates on everything moving the markets, readers can also tune into Tastytrade Live—weekdays from 7 a.m. to 4 p.m. CST—at their convenience.
Get Luckbox! Subscribe to receive 10-issues of Luckbox in print! See SUBSCRIBE or UPGRADE TO PRINT (upper right) for more info or visit getluckbox.com.
Sage Anderson is a pseudonym. He’s an experienced trader of equity derivatives and has managed volatility-based portfolios as a former prop trading firm employee. He’s not an employee of Luckbox, tastytrade or any affiliated companies. Readers can direct questions about this blog or other trading-related subjects, to support@luckboxmagazine.com.