Trading Volatility Using Extremes in the Skew Index
For a comprehensive view of the current risk environment, investors can track the S&P 500 Skew Index, which functions much like the CBOE Volatility Index.

In order to gauge the prevailing risk sentiment on Wall Street, most active investors track the CBOE Volatility Index (VIX), also known as the “fear gauge.”
But for a more robust view of the current risk environment, market participants can also follow the S&P 500 Skew Index. The two metrics are similar but measure different elements of risk in the stock market.
For example, the VIX is calculated using at-the-money (ATM) options in the S&P 500, whereas the Skew Index is calculated using out-of-the-money (OTM) options in the S&P 500. As a result of this subtle difference, the Skew Index is typically viewed as a barometer of “tail risk” in the stock market.
Tail risk in the financial market refers to a form of portfolio risk that captures the remote probability that the value of a given investment could move by more than three standard deviations from its current value. Visualizing a normal bell curve of investment returns, tail risk is therefore captured in the extreme ends of the curve—encompassing rare (and typically eye-popping) outcomes.
Interpretation of the Skew Index is relatively straightforward. Traditionally, the Skew Index trades between 100 and 150, as shown in the chart below.
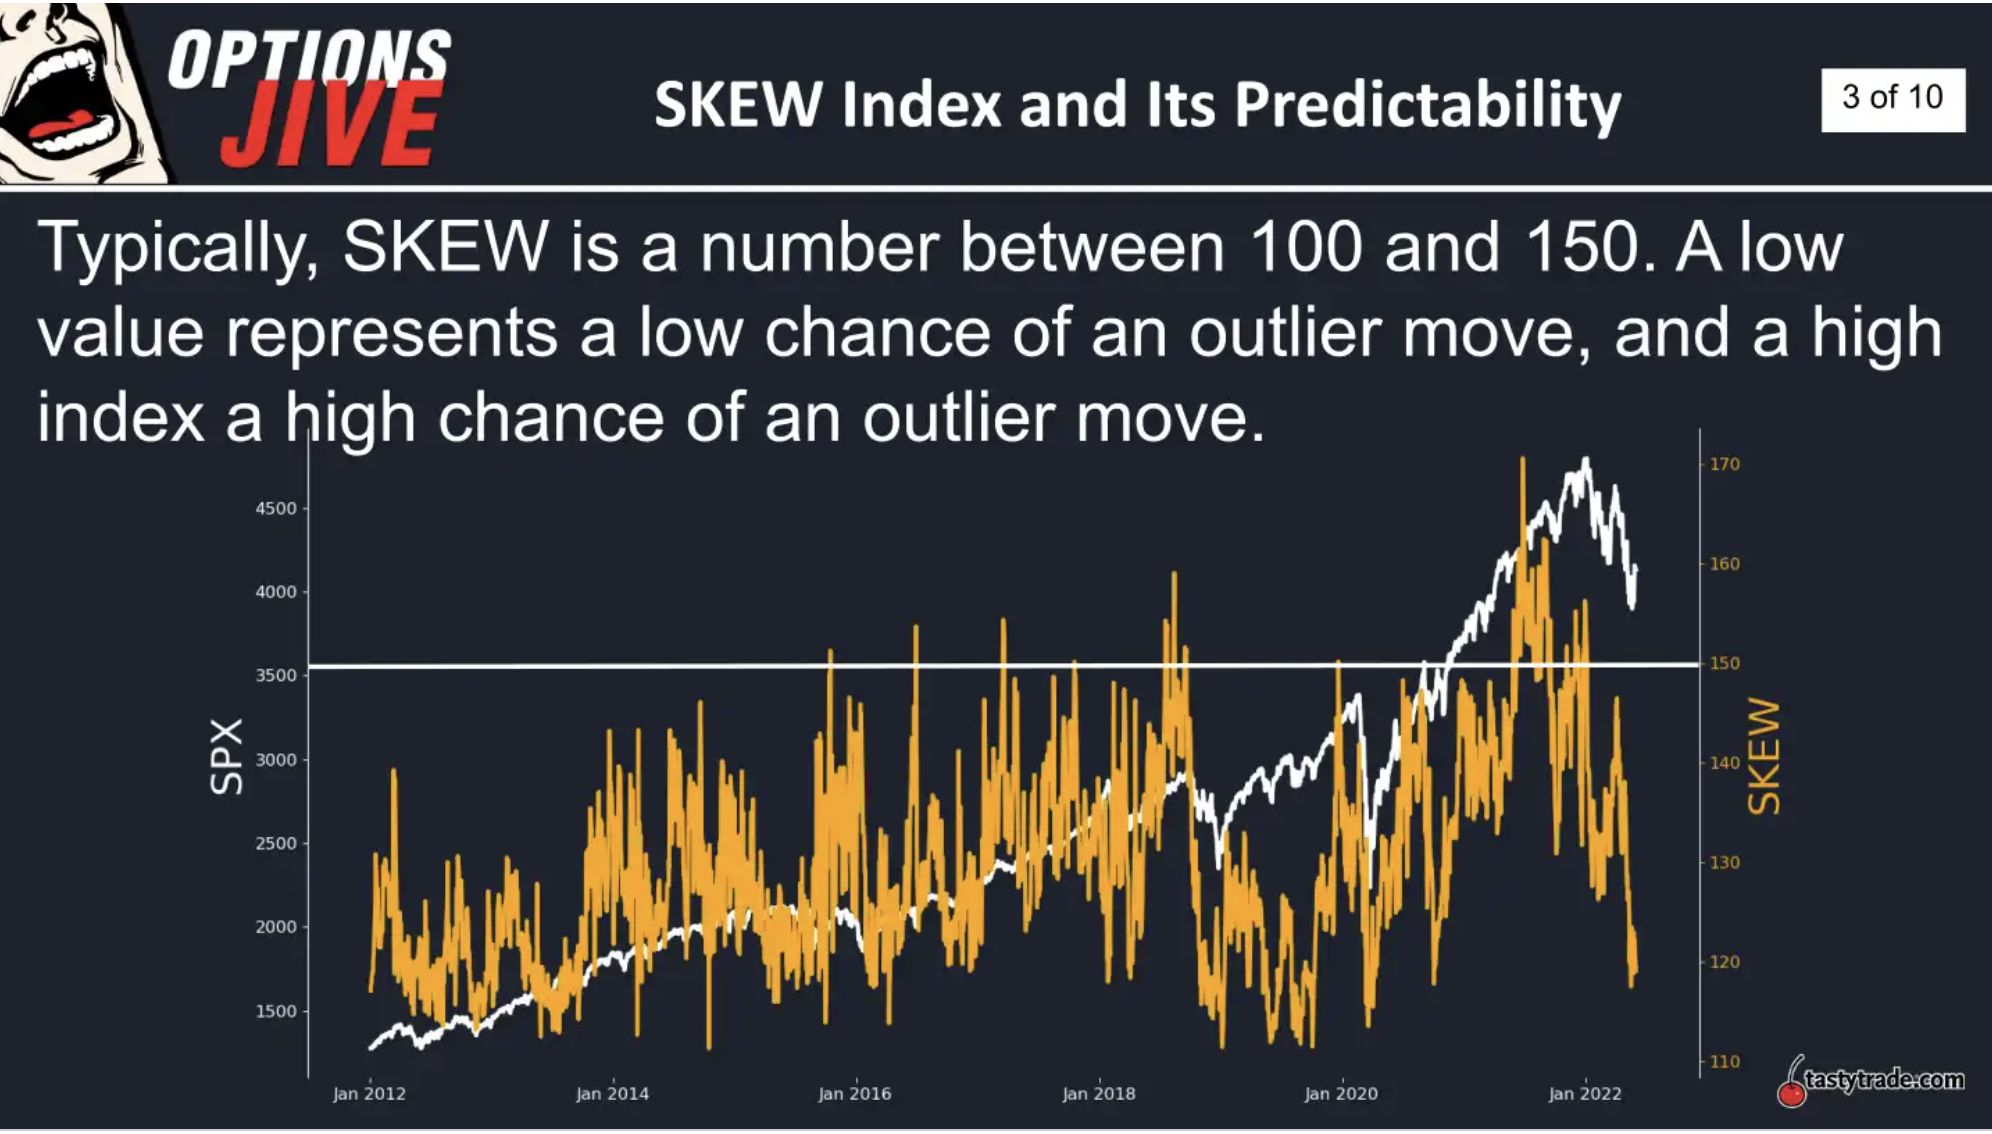
Like the VIX, a lower reading in the Skew Index (100-120) generally translates to a relatively complacent risk environment, whereas an elevated reading in the Skew Index (150 and above) indicates that expectations for a big move in the market are rising or peaking.
This makes sense because purchases of out-of-the-money options typically intensify as fear takes hold in the market, which boosts the value of OTM options and, in turn, the Skew Index.
Interestingly, the Skew Index flashed red on two different occasions during the last seven months, and the stock market moved significantly lower in each of those instances.
In late December 2021, the Skew Index rallied above 150, and in the ensuing weeks the S&P 500 proceeded to drop by more than 400 points. Then, in late March, the Skew Index once again rallied toward 150. Since then, the S&P 500 is down roughly 700 points, or 15%.
This recent data appears to suggest that the Skew Index is an accurate predictor of stock market corrections. However, according to research conducted by tastytrade, that isn’t necessarily the case.
Importantly, the Skew Index merely reflects activity driven by market participants and their expectations for future movement in the stock market. And those market participants aren’t always correct.
For example, between 2014 and 2019 there were multiple instances in which the Skew Index rallied above 140. But only a couple of those actually resulted in a stock market pullback, as illustrated below.

The data highlighted above illustrates that the Skew Index can’t always be relied upon to accurately predict a forthcoming stock market correction. However, it most certainly can serve as an indicator of the prevailing risk sentiment in the stock market.
That means that investors and traders can, at minimum, use the Skew Index to glean further insight into the current trading environment. And while an elevated reading in the Skew Index doesn’t guarantee that a correction will materialize, this may be an indicator that market participants should adhere to more stringent risk management practices.
Whether a correction materializes or not, a drop in the Skew Index furthermore indicates that pressure in the financial markets has abated. A retracement in the Skew Index demonstrates that demand for out-of-the-money options has dropped.
At present, the Skew Index is trading around 122. The 52-week low in the Skew Index is roughly 117, while the 52-week high is 170.
To learn more about the Skew Index, readers are encouraged to review a new installment of Options Jive on the tastytrade financial network. For more on how skew can be traded in the financial markets, this episode of Market Measures is also recommended.
To follow everything moving the markets this summer, readers can also tune into TASTYTRADE LIVE at their convenience.
Get Luckbox! Subscribe to receive 10-issues of Luckbox in print! See SUBSCRIBE or UPGRADE TO PRINT (upper right) for more info or visit getluckbox.com.
Sage Anderson is a pseudonym. He’s an experienced trader of equity derivatives and has managed volatility-based portfolios as a former prop trading firm employee. He’s not an employee of Luckbox, tastytrade or any affiliated companies. Readers can direct questions about this blog or other trading-related subjects, to support@luckboxmagazine.com.